About:
Every project is unique
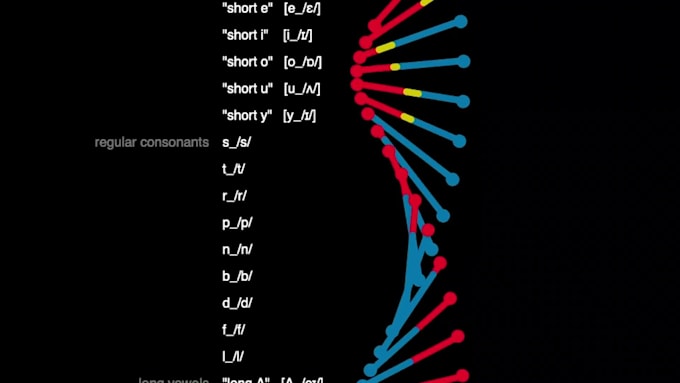
I will design and develop a visualization for your data that is unique, aesthetic and engaging. Coding is done in web-friendly languages (Javascript, p5.js, D3), so the visualization can be integrated into web pages with other content. My products are not bar charts, pie charts or the usual network graph, but totally custom visualizations for simple or complex data.
Collaboration is key
Visualizations can be static or have interactive transitions between states. The only requirement is to have some kind of data. Usually, clients come to me with a concept or idea from which we work through the details, going through several prototypes.
Code is reusable
Visualizations can be used for finding information patterns, enhancing storytelling, prototyping bigger projects or just for showing off. When I deliver the source code, you can freely update the data, so they are reusable. If needed, I can keep your visualization online on my server for you, free of charge.
Reviews
: : : : :


